Customizing Parameters
Contents
Customizing Parameters#
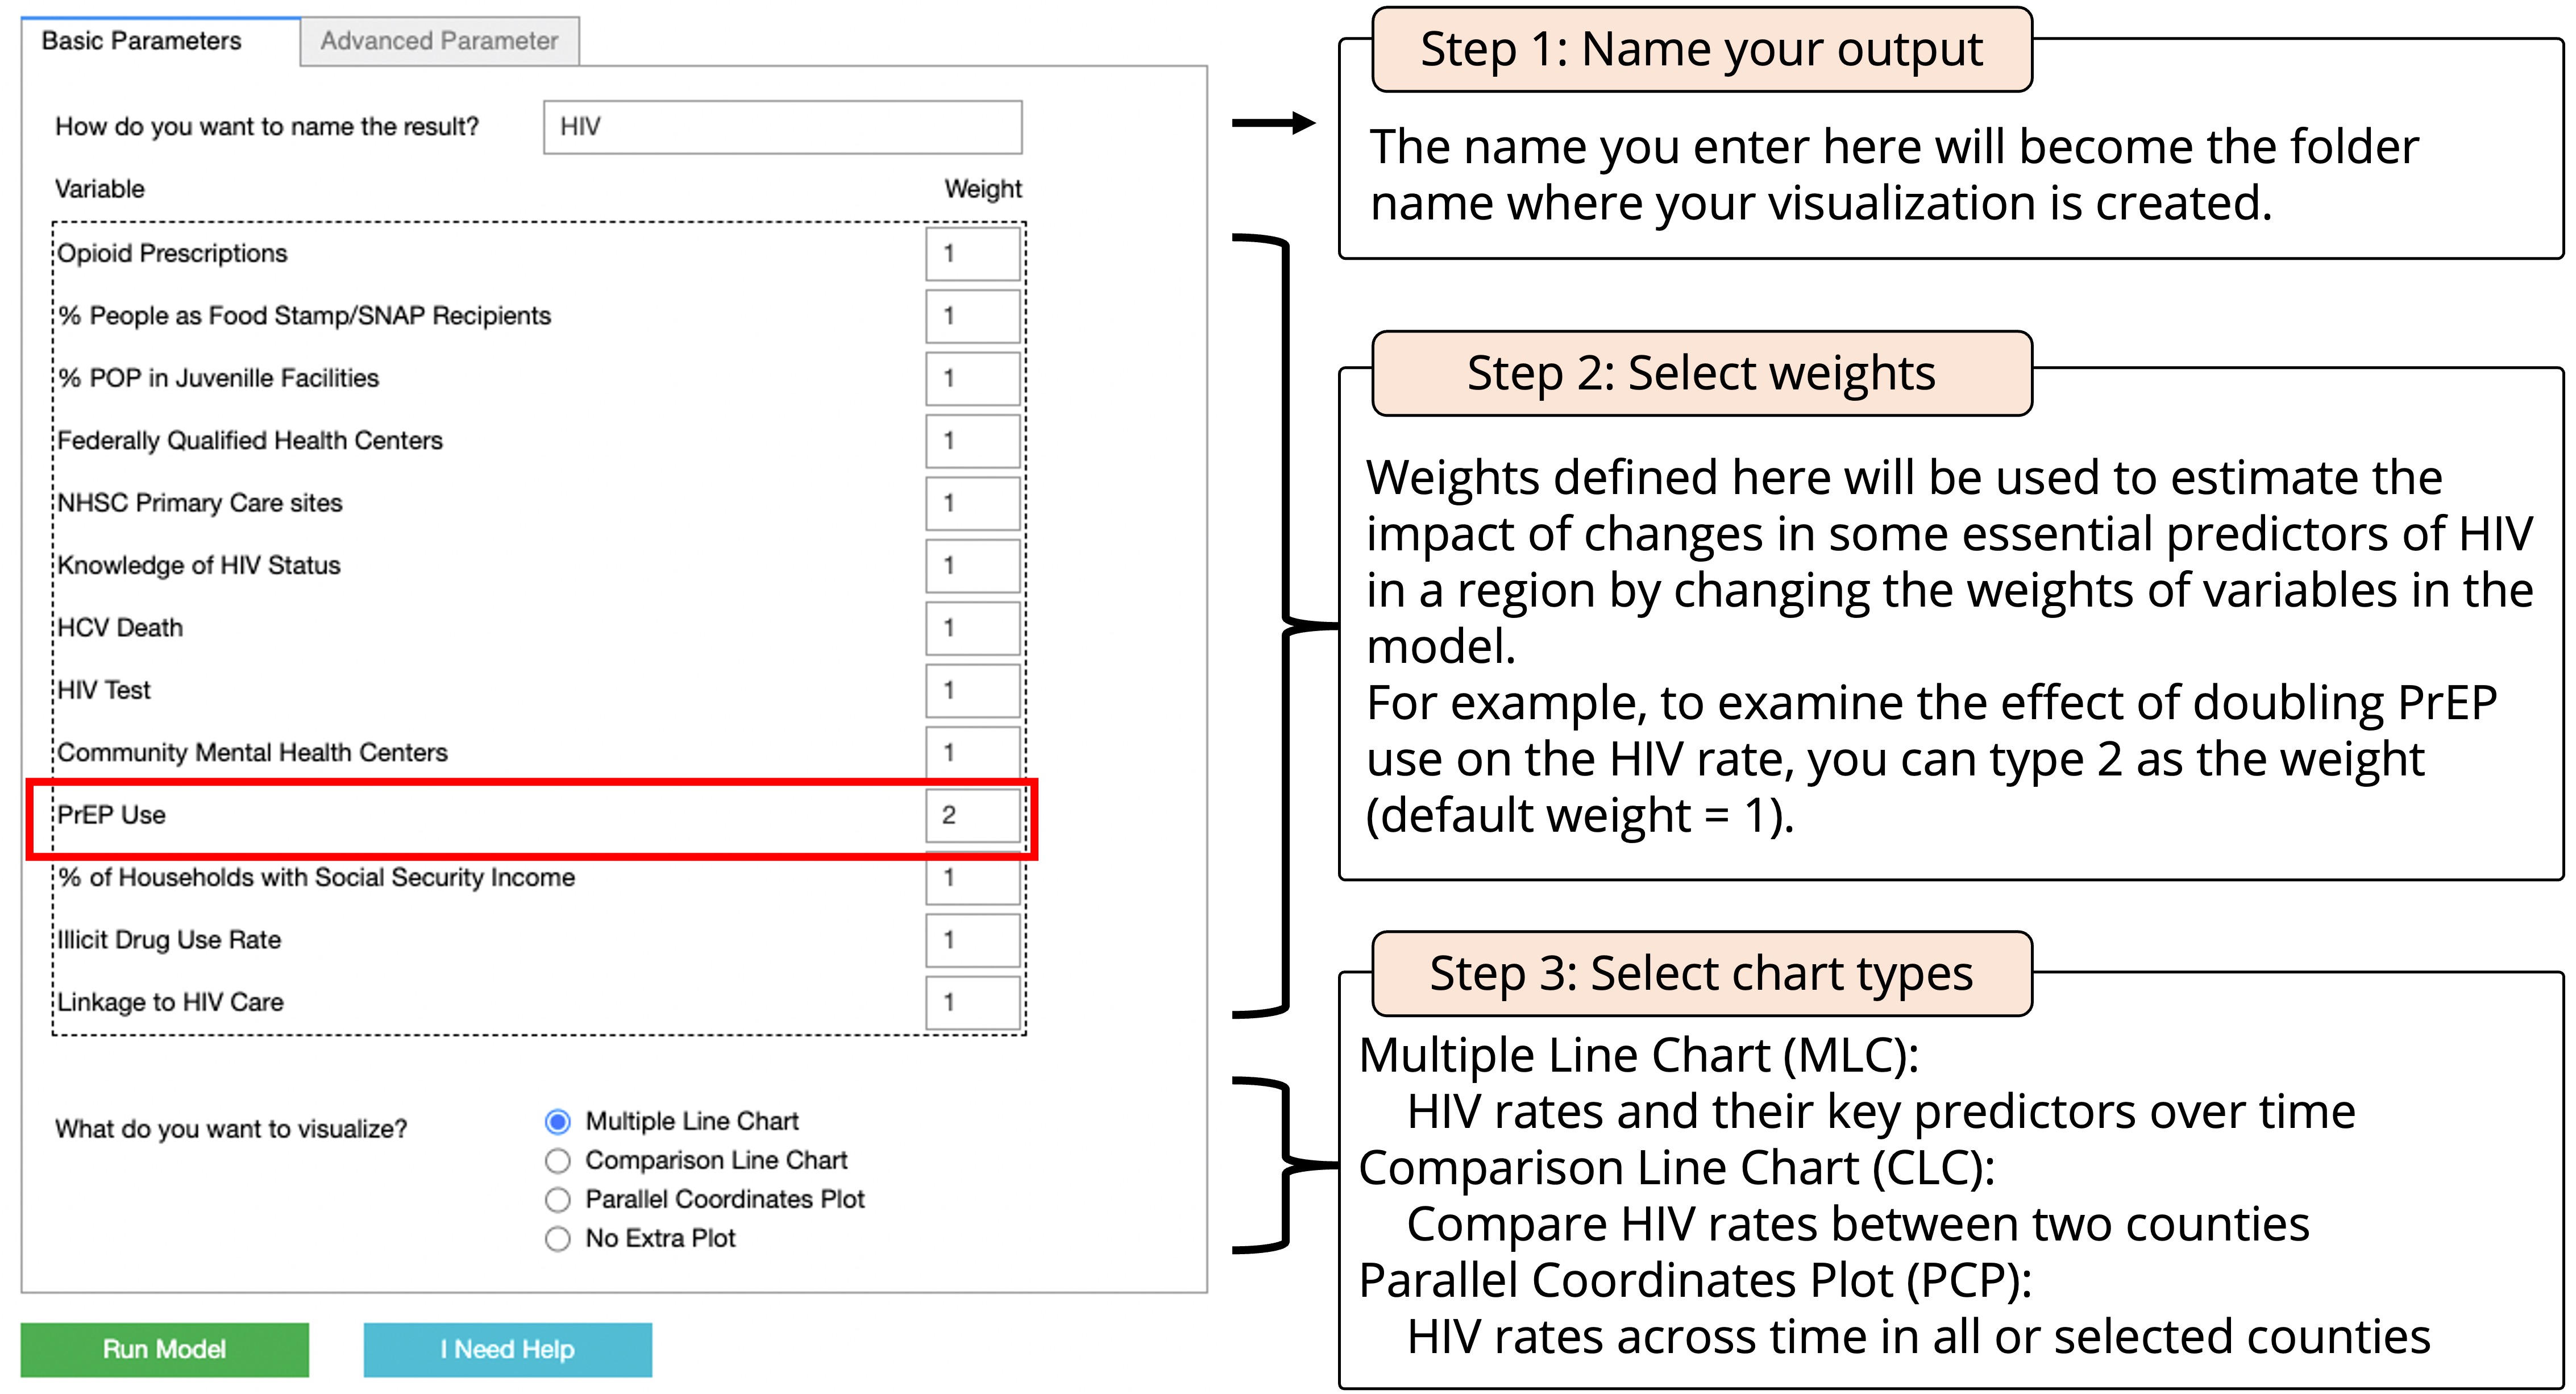
Basic Parameters#
The first tab has basic parameters and the second tab has advanced parameters. You can change between basic and advanced parameters by clicking the tab in the image below.
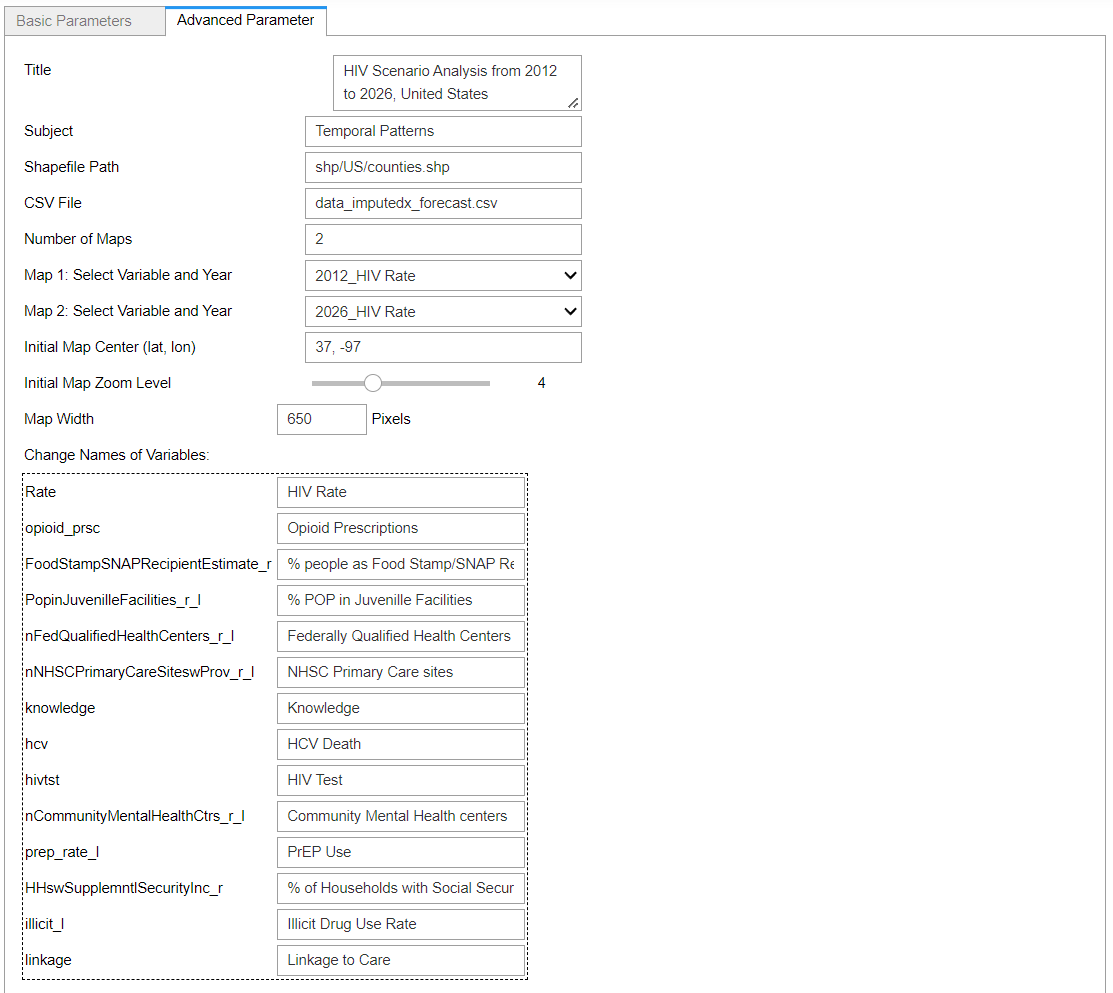
Advanced Parameters#
Parameter |
Description |
|---|---|
|
Title text that would appear in the top of the result visualization file. |
|
File path of shapefile that would be a base map layer to map visualization. |
|
File path of the CSV file that you want to visualize on the maps. |
|
Number of maps to visualize in the HTML file. |
|
Layers you want to visualize in the maps. |
|
Longitude and latitude coordinates of the map center. |
|
Set the zoom level for maps. Increasing the number will zoom-in maps. |
|
Set the width of the map in pixels |
|
Enter variable names to be visualized in the visualization. |
Parameters below are specific to different chart types for Multiple Line Chart(MLC), Comparison Line Chart (CLC), and Parallel Coordinate Plot(PCP) respectively.
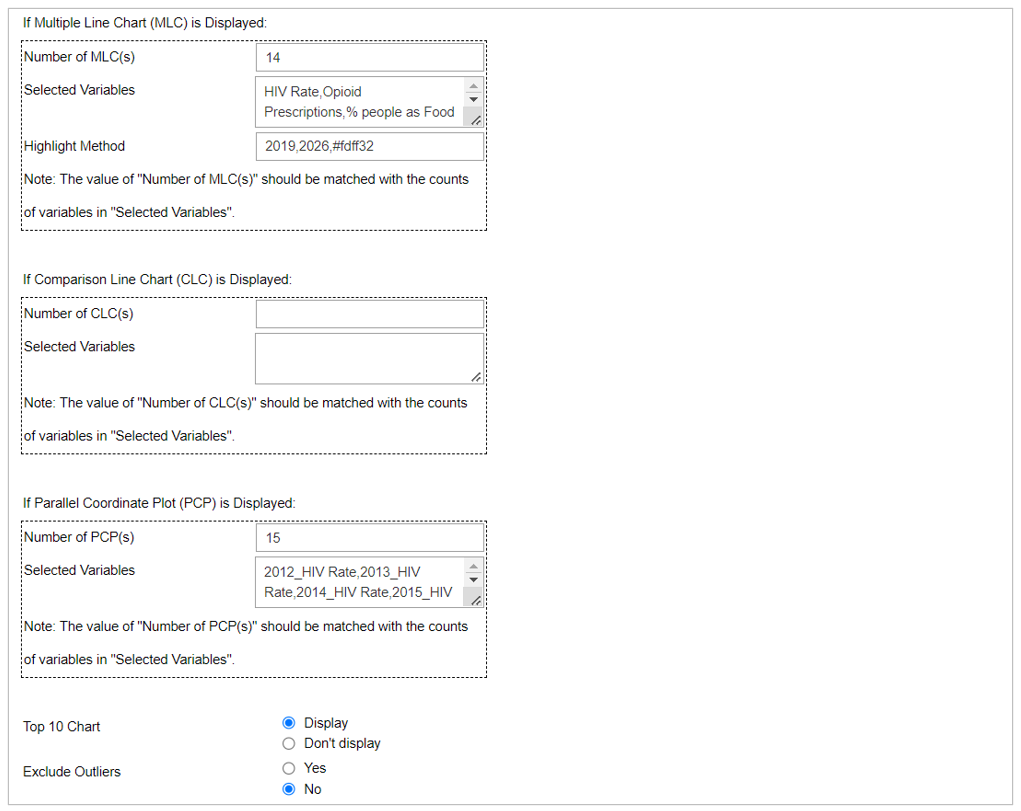
Multiple Line Chart(MLC)
Parameter |
Description |
|---|---|
|
The number of MLC charts. |
|
Names of variables to be visualized in MLC. e.g. HIV Rate,Opioid Prescriptions |
|
This parameter only applies to MLC. Determine which time period to highlight, and in which color in ‘start time, end time, colorcode’ format (e.g., 2019, 2026, #fdff32). |
Comparison Line Chart (CLC)
Parameter |
Description |
|---|---|
|
The number of values on the X-axis of CLC. |
|
|
Parallel Coordinate Plot(PCP)
Parameter |
Description |
|---|---|
|
The number of variables in the PCP chart. |
|
|
More Options
Parameter |
Description |
|---|---|
|
A Top 10 Chart linked with the right-side map. |
|
Exclude extreme outliers to avoid skewed results. |